Edit chart
Loading graph
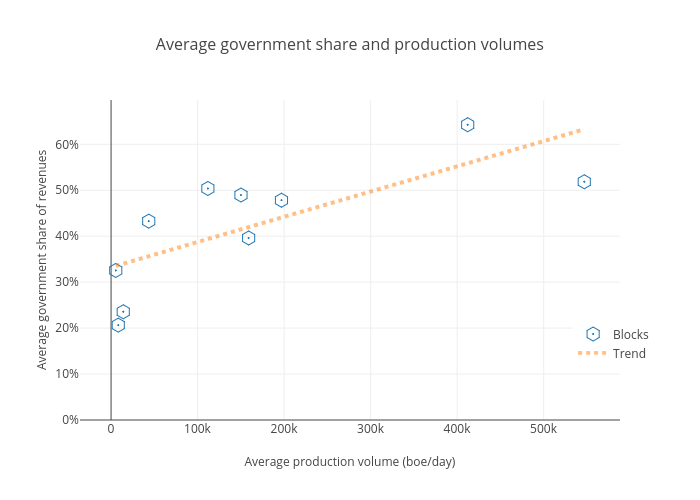
Davidmihalyi's interactive graph and data of "Average government share and production volumes" is a scatter chart, showing Blocks vs Trend; with Average production volume (boe/day) in the x-axis and Average government share of revenues in the y-axis.. The x-axis shows values from -30873.80821908608 to 583173.6135098467. The y-axis shows values from 0 to 0.6943617495086943.