Edit chart
Loading graph
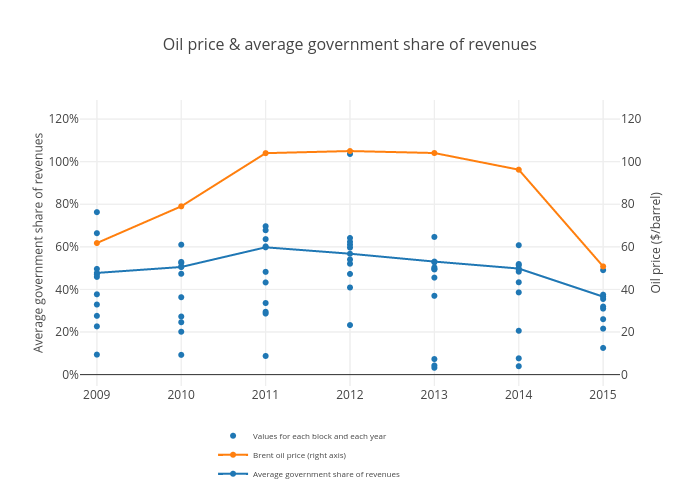
Davidmihalyi's interactive graph and data of "Oil price & average government share of revenues" is a scatter chart, showing Values for each block and each year, Brent oil price (right axis) , Average government share of revenues; with Average government share of revenues in the y-axis. The x-axis shows values from 2008.8 to 2015.2. The y-axis shows values from -0.05371335998162702 to 1.2898296739945594.