Edit chart
Loading graph
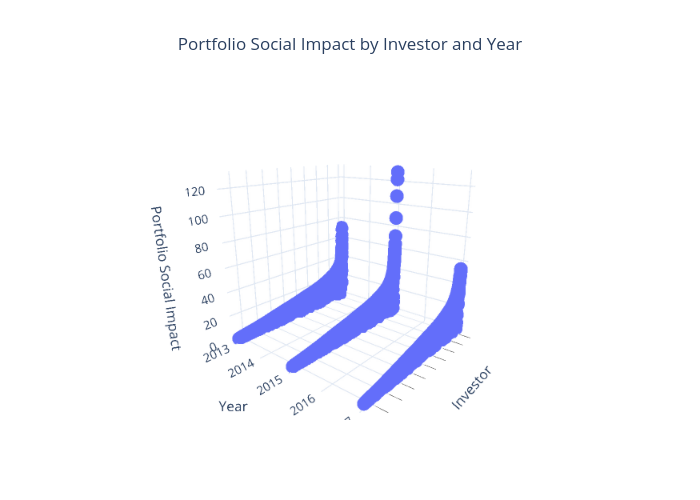
Dcleres's interactive graph and data of "Portfolio Social Impact by Investor and Year" is a scatter3d. The x-axis shows values from -1 to 6. The y-axis shows values from -1 to 4.