Edit chart
Loading graph
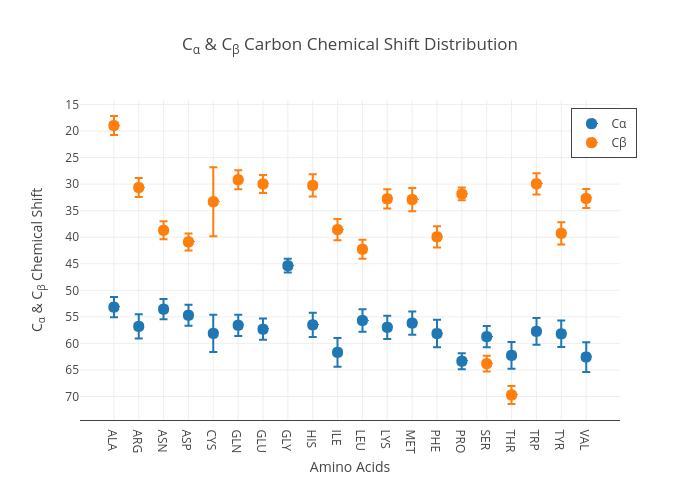
Debsahu's interactive graph and data of "Cα & Cβ Carbon Chemical Shift Distribution" is a scatter chartwith vertical error bars, showing Cα vs Cβ ; with Amino Acids in the x-axis and Cα & Cβ Chemical Shift in the y-axis.. The x-axis shows values from -1.2376277990340587 to 20.23762779903406. The y-axis shows values from 74.42200000000001 to 14.162.