Edit chart
Loading graph
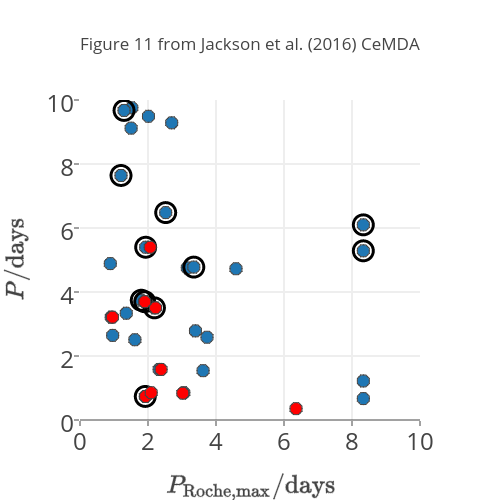
Decaelus's interactive graph and data of "Figure 11 from Jackson et al. (2016) CeMDA" is a scatter chart; with $P_{\rm Roche, max}/{\rm days}$ in the x-axis and $P/{\rm days}$ in the y-axis.. The x-axis shows values from 0 to 10. The y-axis shows values from 0 to 10.