Edit chart
Loading graph
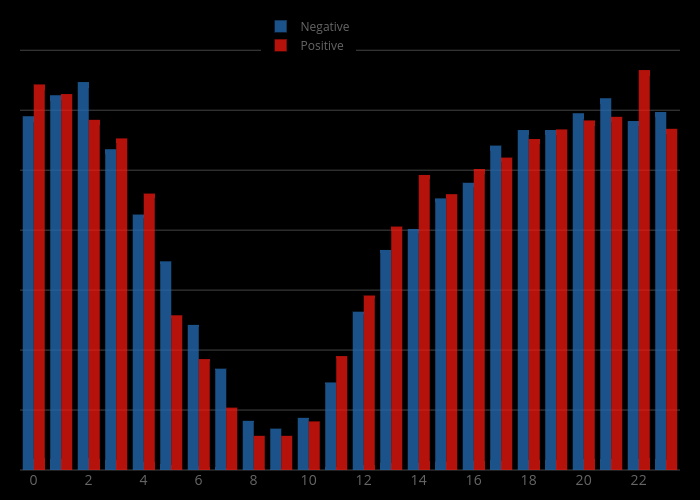
Denys.n.k's interactive graph and data of "Negative vs Positive" is a histogram, showing Negative vs Positive. The x-axis shows values from -0.5 to 23.5. The y-axis shows values from 0 to 702.1052631578948.