Edit chart
Loading graph
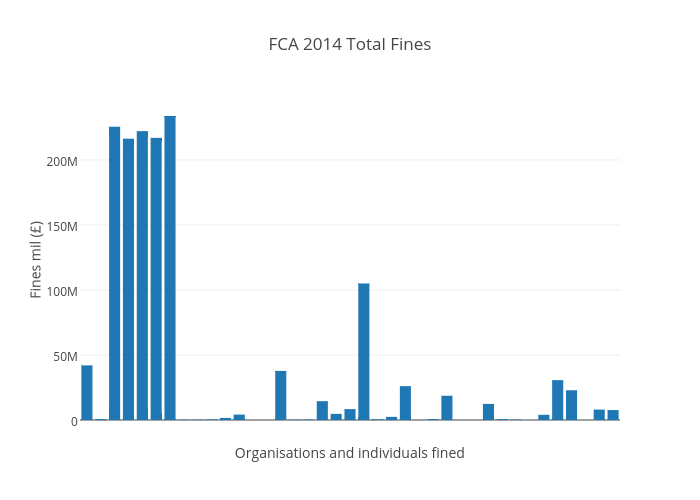
Dezhamer's interactive graph and data of "FCA 2014 Total Fines" is a bar chart, showing Ammount fined mil (£); with Organisations and individuals fined in the x-axis and Fines mil (£) in the y-axis.. The x-axis shows values from -0.5 to 38.5. The y-axis shows values from 0 to 246120000.