Edit chart
Loading graph
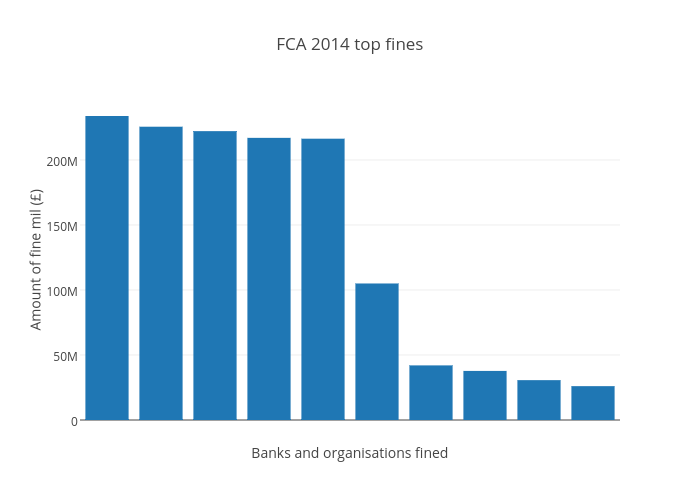
Dezhamer's interactive graph and data of "FCA 2014 top fines" is a bar chart, showing Col3; with Banks and organisations fined in the x-axis and Amount of fine mil (£) in the y-axis.. The x-axis shows values from -0.5 to 9.5. The y-axis shows values from 0 to 246120000.