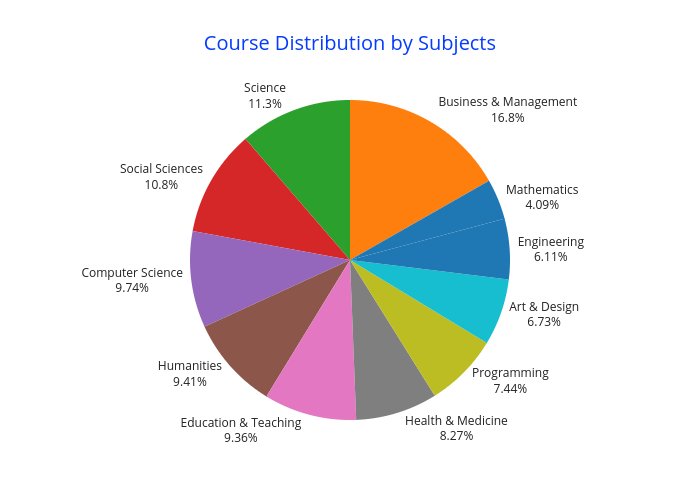
Business & Management
16.8%
Science
11.3%
Social Sciences
10.8%
Computer Science
9.74%
Humanities
9.41%
Education & Teaching
9.36%
Health & Medicine
8.27%
Programming
7.44%
Art & Design
6.73%
Engineering
6.11%
Mathematics
4.09%
Course Distribution by Subjects
plotly-logomark
Edit chart
Dhawalhs's interactive graph and data of "Course Distribution by Subjects" is a pie, showing Col2. The x-axis shows values from 0 to 0. The y-axis shows values from 0 to 0.