Jan 2012
Jul 2012
Jan 2013
Jul 2013
Jan 2014
Jul 2014
Jan 2015
Jul 2015
Jan 2016
0
500
1000
1500
2000
2500
3000
3500
4000
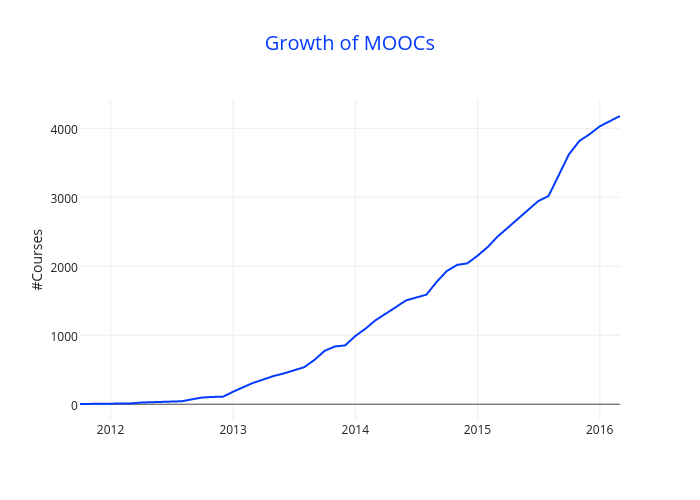
Growth of MOOCs
#Courses
plotly-logomark
Edit chart
Dhawalhs's interactive graph and data of "Growth of MOOCs" is a scatter chart, showing Col2; with time in the x-axis and #Courses in the y-axis.. The x-axis shows values from 1317452400000 to 1456819200000. The y-axis shows values from -229.05555555555554 to 4412.