Edit chart
Loading graph
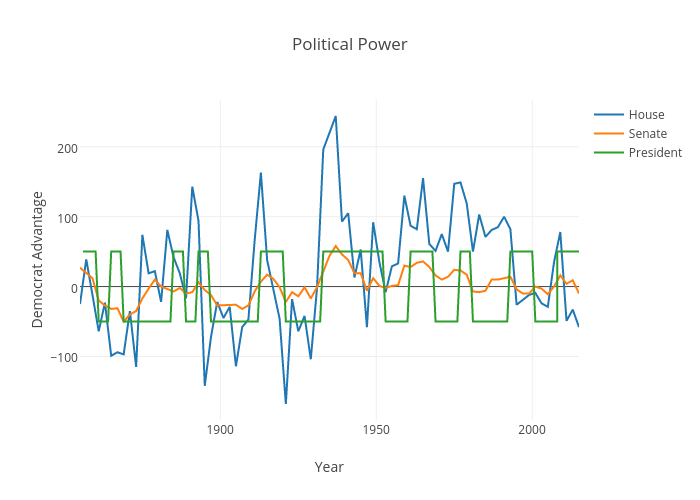
Divergent.data's interactive graph and data of "Political Power" is a scatter chart, showing House, Senate, President; with Year in the x-axis and Democrat Advantage in the y-axis.. The x-axis shows values from 0 to 0. The y-axis shows values from 0 to 0.