Edit chart
Loading graph
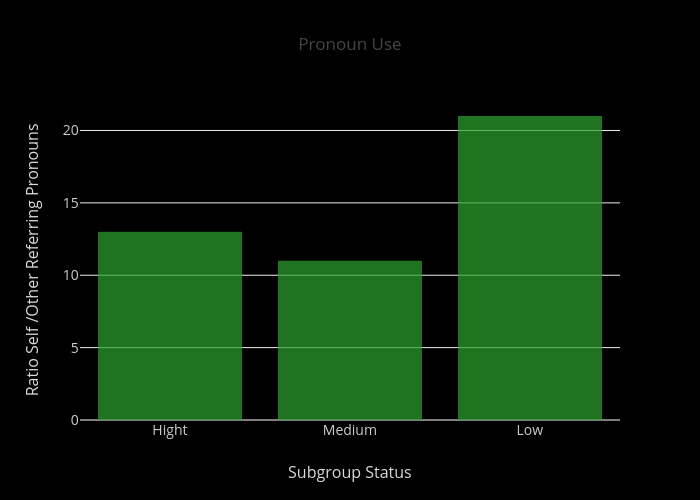
Dk-lab's interactive graph and data of "Pronoun Use" is a bar chart; with Subgroup Status in the x-axis and Ratio Self /Other Referring Pronouns in the y-axis.. The x-axis shows values from -0.5 to 2.5. The y-axis shows values from 0 to 22.105263157894736.