Edit chart
Loading graph
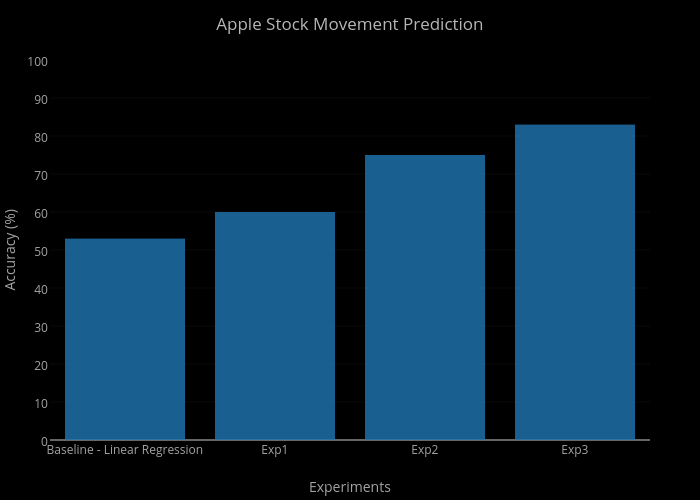
Dk-lab's interactive graph and data of "Apple Stock Movement Prediction" is a bar chart, showing Accuracy (%); with Experiments in the x-axis and Accuracy (%) in the y-axis.. The x-axis shows values from -0.5 to 3.5. The y-axis shows values from 0 to 100.