Edit chart
Loading graph
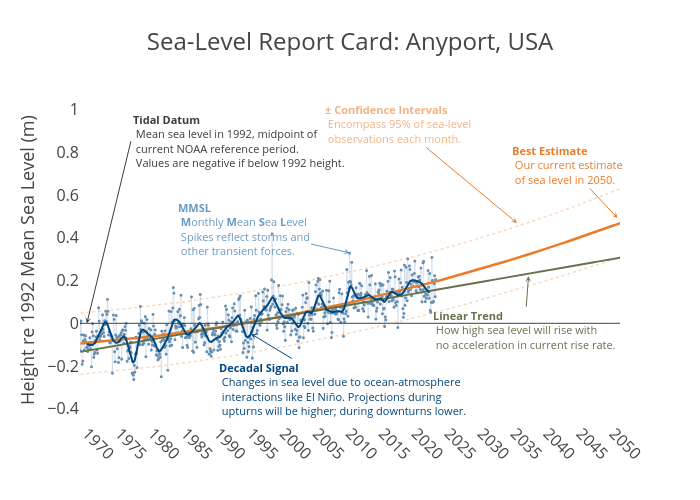
Dlmalm's interactive graph and data of "Sea-Level Report Card: Anyport, USA" is a line chart, showing Observed MMSL, Quadratic Trend, QHi95, QLo95, Linear Trend, Decadal Signal; with in the x-axis and Height re 1992 Mean Sea Level (m) in the y-axis.. The x-axis shows values from 1968-12-15 02:40 to 2050-12-05 19:33:20. The y-axis shows values from -0.4523022287027027 to 1.0446362967027027. This visualization has the following annotations: Best Estimate Our current estimate of sea level in 2050.; Linear Trend How high sea level will rise with no acceleration in current rise rate.; MMSL Monthly Mean Sea Level Spikes reflect storms and other transient forces.; Tidal Datum Mean sea level in 1992, midpoint of current NOAA reference period. Values are negative if below 1992 height.; Decadal Signal Changes in sea level due to ocean-atmosphere interactions like El Niño. Projections during upturns will be higher; during downturns lower.; ± Confidence Intervals Encompass 95% of sea-level observations each month.