Edit chart
Loading graph
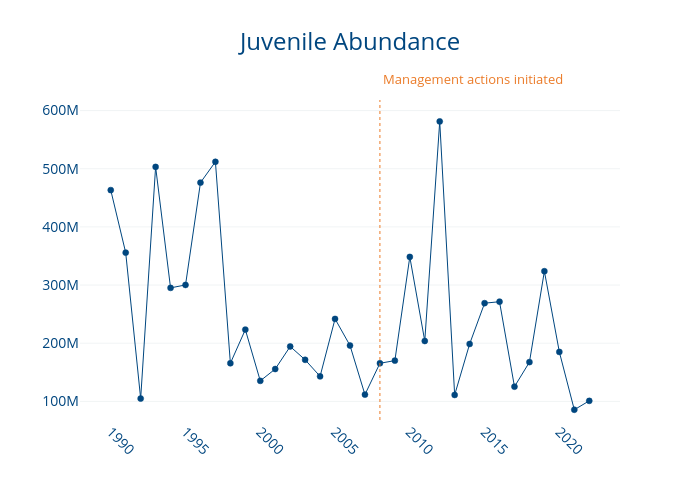
Dlmalm's interactive graph and data of "Juvenile Abundance" is a line chart, showing Millions; with in the x-axis and in the y-axis.. The x-axis shows values from 1988.0197418375094 to 2023.9802581624906. The y-axis shows values from 68036650.835958 to 618127666.164042. This visualization has the following annotation: Management actions initiated