Edit chart
Loading graph
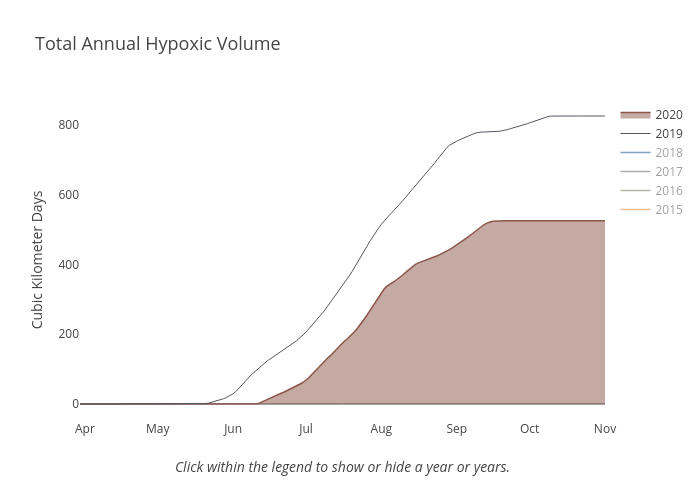
Dlmalm's interactive graph and data of "Total Annual Hypoxic Volume" is a line chart, showing 2020, 2019, 2018, 2017, 2016, 2015; with Click within the legend to show or hide a year or years. in the x-axis and Cubic Kilometer Days in the y-axis.. The x-axis shows values from 2014-03-30 to 2014-11-01. The y-axis shows values from -45.87777777777778 to 871.6777777777777.