Edit chart
Loading graph
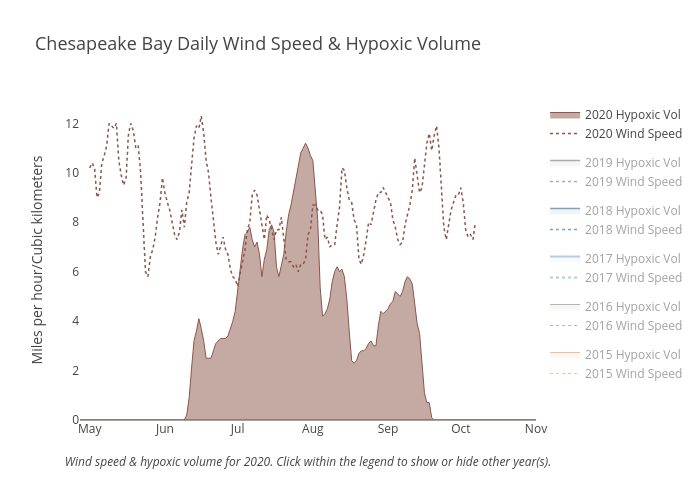
Dlmalm's interactive graph and data of "Chesapeake Bay Daily Wind Speed & Hypoxic Volume" is a line chart, showing 2020 Wind Speed, 2020 Hypoxic Vol, 2019 Wind Speed, 2019 Hypoxic Vol, 2018 Wind Speed, 2018 Hypoxic Vol, 2017 Wind Speed, 2017 Hypoxic Vol, 2016 Wind Speed, 2016 Hypoxic Vol, 2015 Wind Speed, 2015 Hypoxic Vol; with Wind speed & hypoxic volume for 2020. Click within the legend to show or hide other year(s). in the x-axis and Miles per hour/Cubic kilometers in the y-axis.. The x-axis shows values from 2014-04-27 to 2014-11-01. The y-axis shows values from 0 to 12.947368421052632.