Edit chart
Loading graph
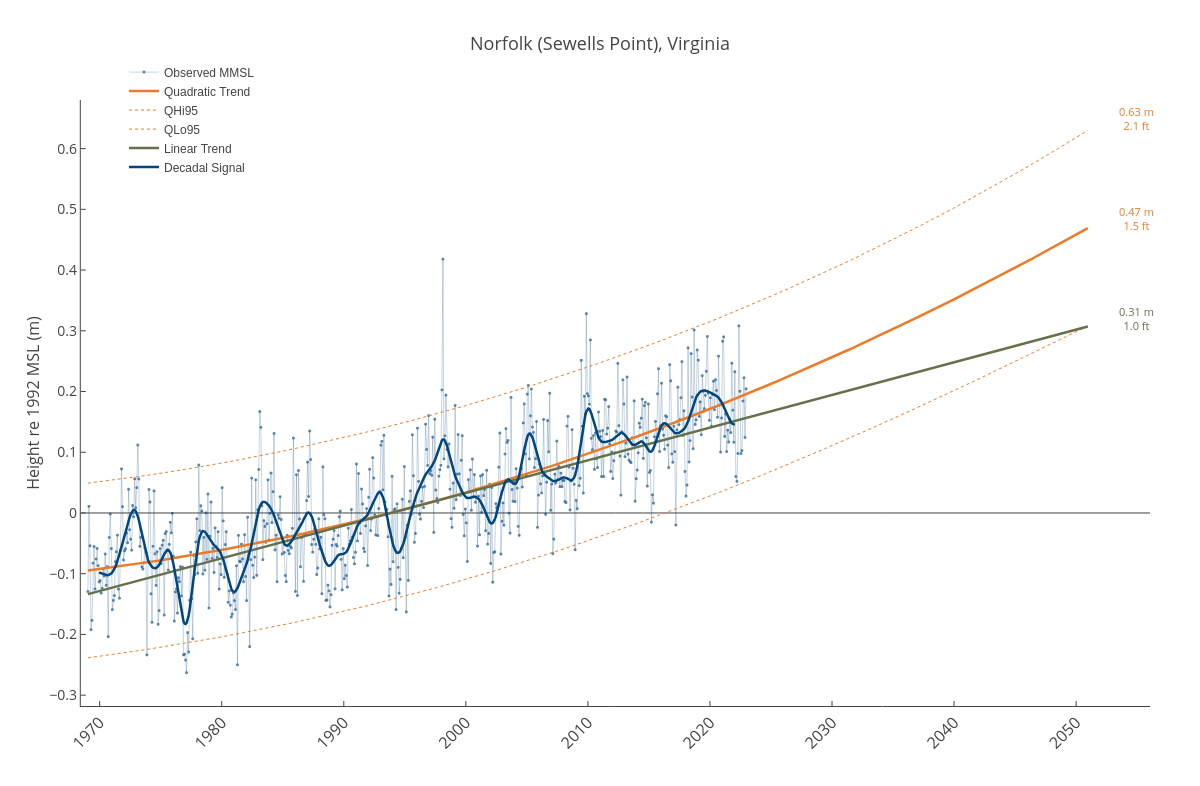
Dlmalm's interactive graph and data of "Norfolk (Sewells Point), Virginia" is a line chart, showing Observed MMSL, Quadratic Trend, QHi95, QLo95, Linear Trend, Decadal Signal; with in the x-axis and Height re 1992 MSL (m) in the y-axis.. The x-axis shows values from 1968-06-15 04:45:41.3449 to 2056-01-20 08:07:04.2717. The y-axis shows values from -0.31782258794247786 to 0.6800317151548673. This visualization has the following annotations: 0.47 m1.5 ft; 0.31 m1.0 ft; 0.63 m2.1 ft