Edit chart
Loading graph
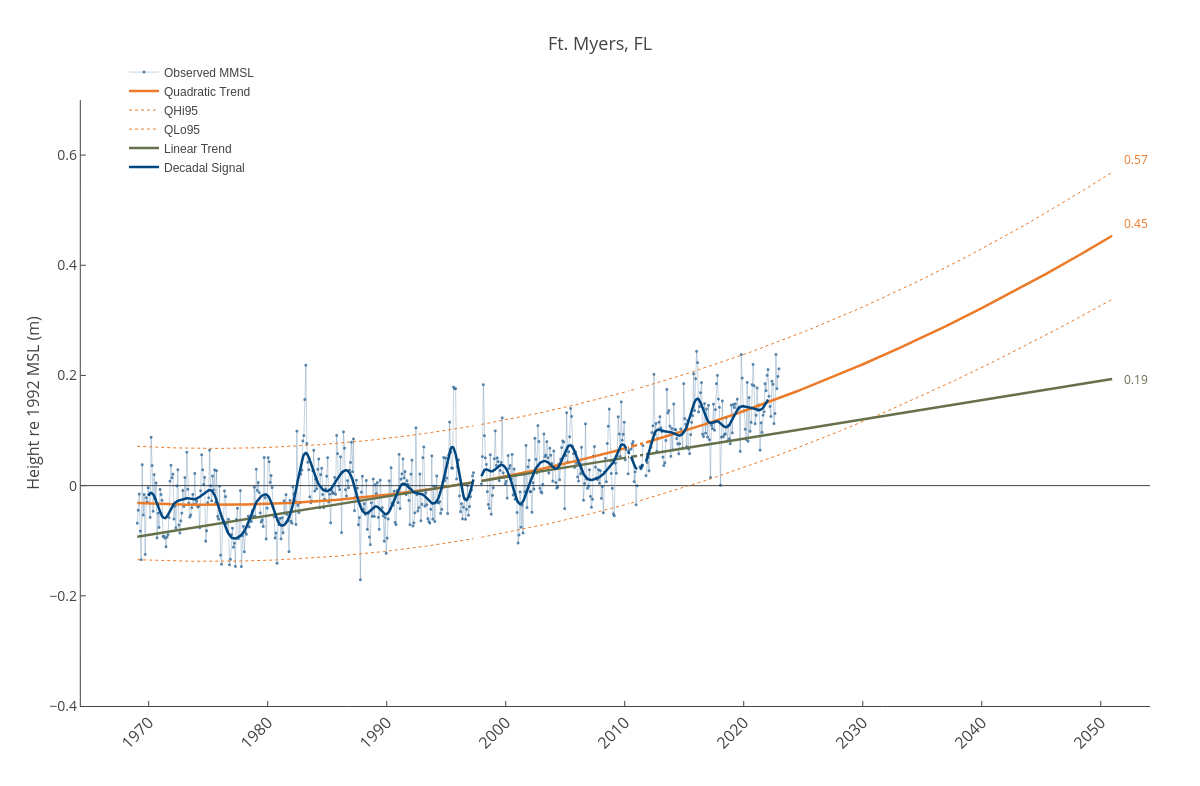
Dlmalm's interactive graph and data of "Ft. Myers, FL" is a line chart, showing Observed MMSL, Quadratic Trend, QHi95, QLo95, Linear Trend, Decadal Signal; with in the x-axis and Height re 1992 MSL (m) in the y-axis.. The x-axis shows values from 1964-04-18 05:27:10.6678 to 2054-02-19 06:24:03.9505. The y-axis shows values from -0.4 to 0.7. This visualization has the following annotations: 0.45; 0.19; 0.57