Edit chart
Loading graph
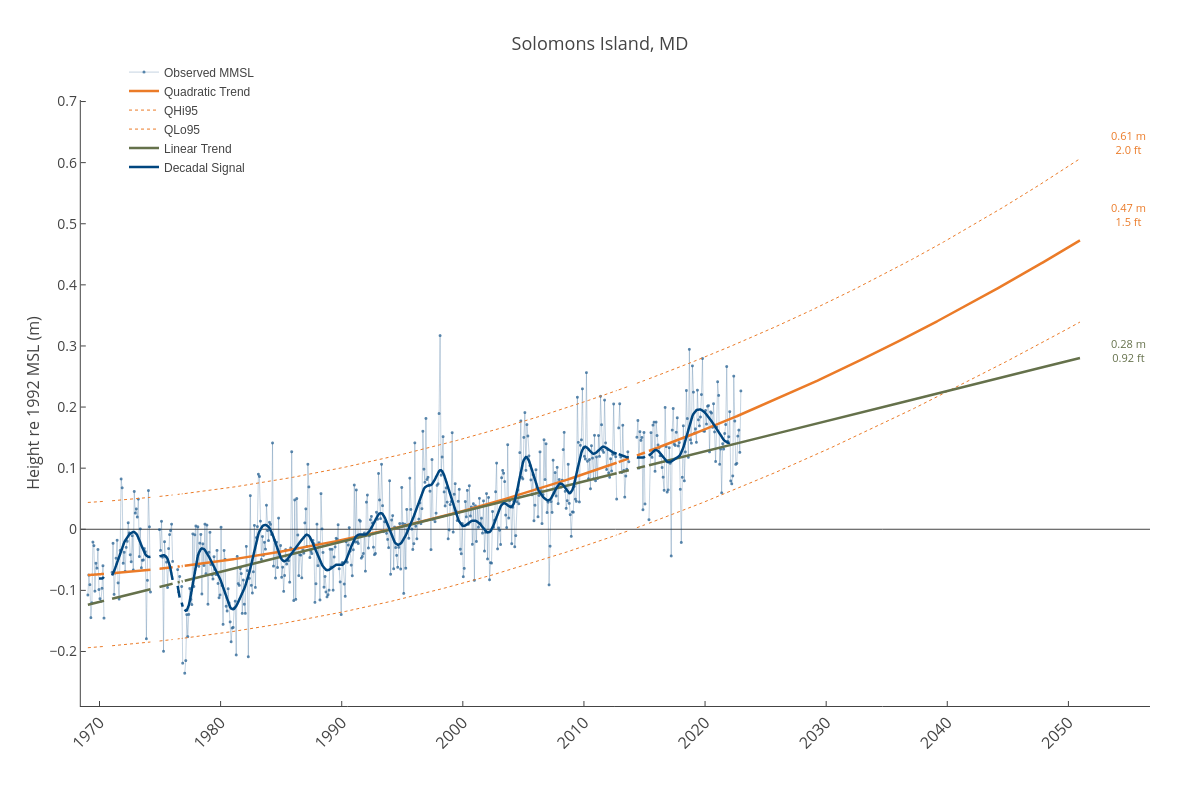
Dlmalm's interactive graph and data of "Solomons Island, MD" is a line chart, showing Observed MMSL, Quadratic Trend, QHi95, QLo95, Linear Trend, Decadal Signal; with in the x-axis and Height re 1992 MSL (m) in the y-axis.. The x-axis shows values from 1968-06-15 23:55:21.2628 to 2056-09-26 15:32:38.3471. The y-axis shows values from -0.2892269480088495 to 0.7025193130530973. This visualization has the following annotations: 0.47 m1.5 ft; 0.28 m0.92 ft; 0.61 m2.0 ft