Edit chart
Loading graph
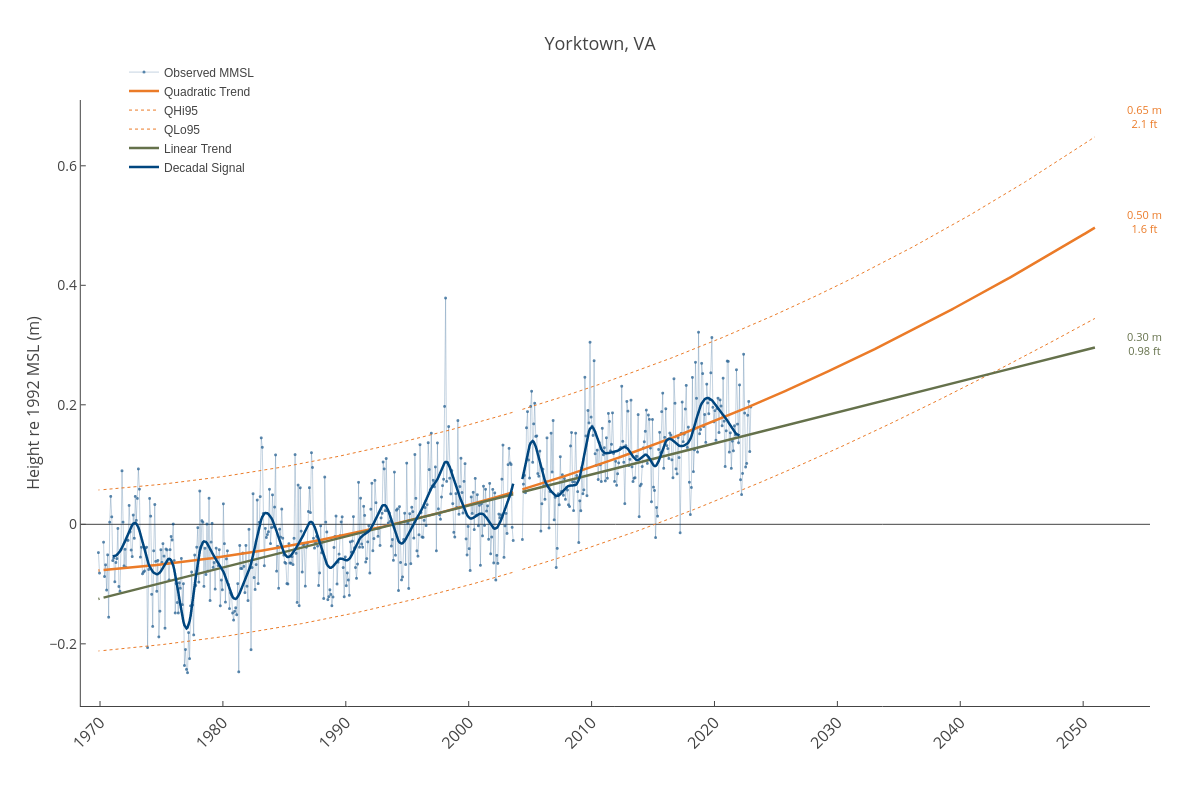
Dlmalm's interactive graph and data of "Yorktown, VA" is a line chart, showing Observed MMSL, Quadratic Trend, QHi95, QLo95, Linear Trend, Decadal Signal; with in the x-axis and Height re 1992 MSL (m) in the y-axis.. The x-axis shows values from 1968-06-08 15:10:12.8762 to 2055-06-10 09:03:05.4004. The y-axis shows values from -0.3040487055016181 to 0.7101133225458468. This visualization has the following annotations: 0.50 m1.6 ft; 0.30 m0.98 ft; 0.65 m2.1 ft