Edit chart
Loading graph
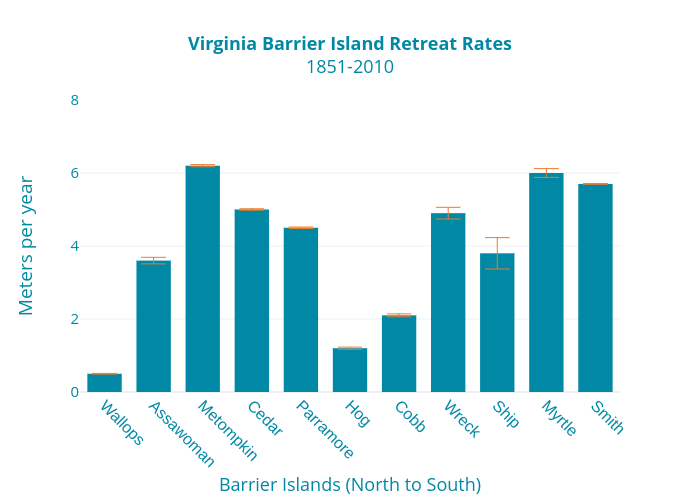
Dlmalm's interactive graph and data of "Virginia Barrier Island Retreat Rates1851-2010" is a bar chartwith vertical error bars, showing Retreat Rates; with Barrier Islands (North to South) in the x-axis and Meters per year in the y-axis.. The x-axis shows values from -0.5 to 10.5. The y-axis shows values from 0 to 8.