Edit chart
Loading graph
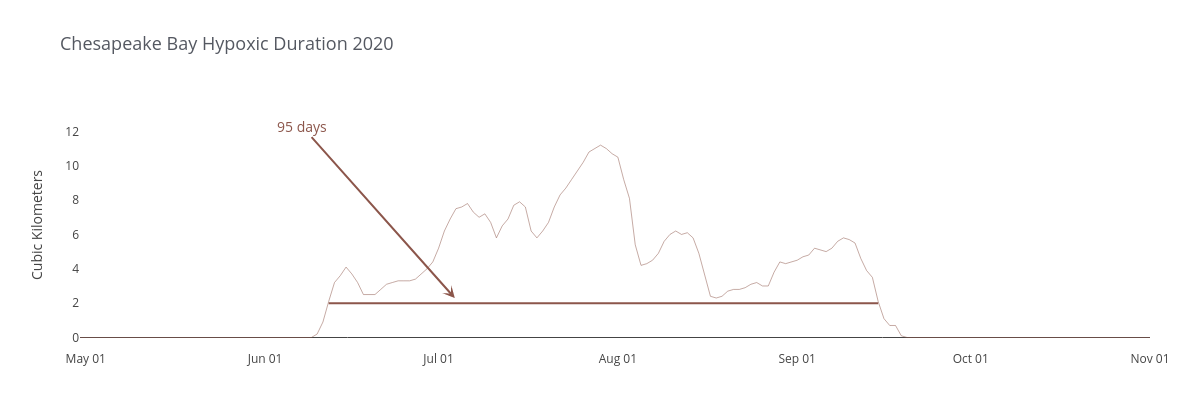
Dlmalm's interactive graph and data of "Chesapeake Bay Hypoxic Duration 2020" is a line chart, showing 2020; with time in the x-axis and Cubic Kilometers in the y-axis.. The x-axis shows values from 2014-04-30 to 2014-11-01 . The y-axis shows values from -0.7277777777777777 to 13.827777777777778. This visualization has the following annotation: 95 days