Edit chart
Loading graph
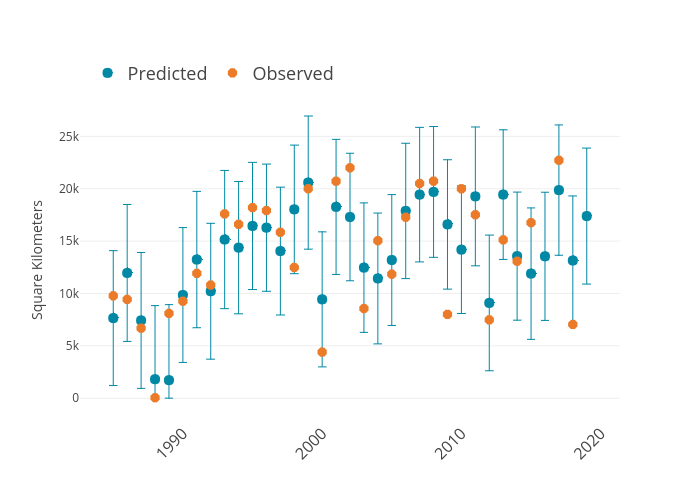
Dlmalm's interactive graph and data of "Square Kilometers vs " is a scatter chart, showing Predicted vs Observed; with in the x-axis and Square Kilometers in the y-axis.. The x-axis shows values from 1982.918791235644 to 2021.081208764356. The y-axis shows values from -1987.7777901216039 to 28469.28304158535.