Edit chart
Loading graph
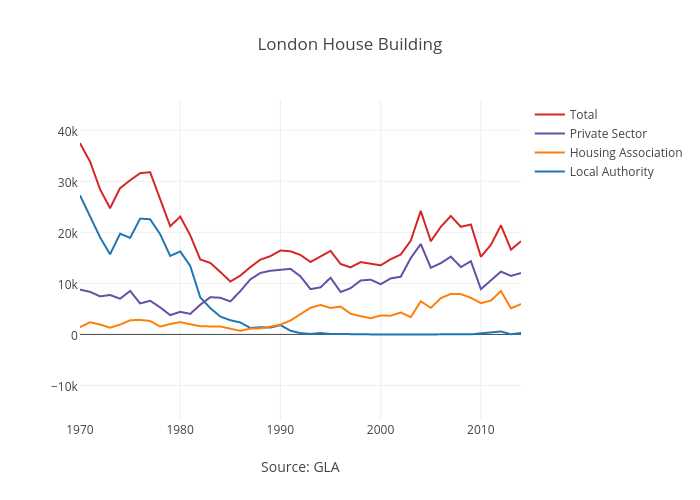
Dpyper's interactive graph and data of "London House Building" is a scatter chart, showing Local Authority, Housing Association, Private Sector, Total; with Source: GLA in the x-axis. The x-axis shows values from 1970 to 2014. The y-axis shows values from -16764.445910861483 to 45912.47698190155.