Edit chart
Loading graph
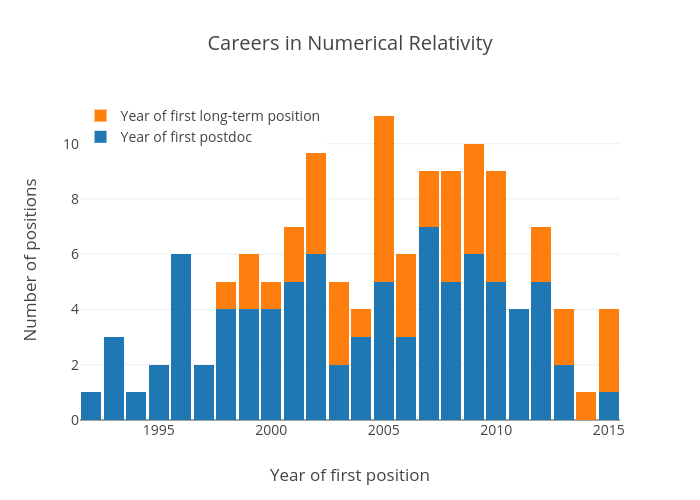
Dr.ian.hawke's interactive graph and data of "Careers in Numerical Relativity" is a histogram, showing Year of first postdoc vs Year of first long-term position; with Year of first position in the x-axis and Number of positions in the y-axis.. The x-axis shows values from 1991.5 to 2015.5. The y-axis shows values from 0 to 11.578947368421053.