Edit chart
Loading graph
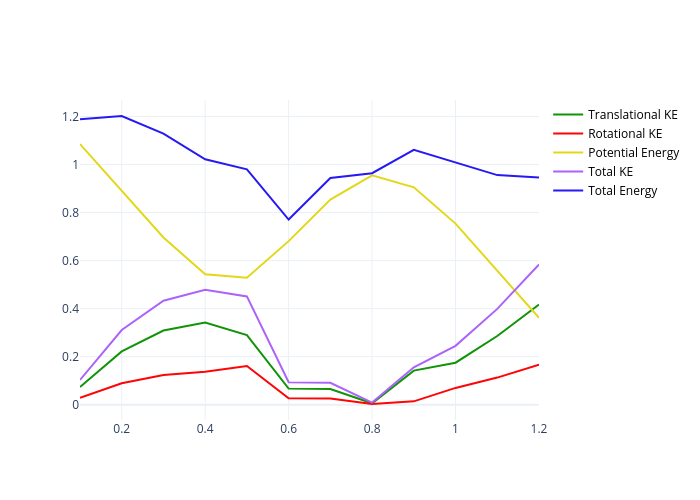
Drewbbarkk's interactive graph and data of "Translational KE , Rotational KE, Potential Energy , Total KE, Total Energy" is a line chart, showing Translational KE , Rotational KE, Potential Energy , Total KE, Total Energy. The x-axis shows values from 0.1 to 1.2. The y-axis shows values from -0.06361111111111112 to 1.2686111111111111.