Edit chart
Loading graph
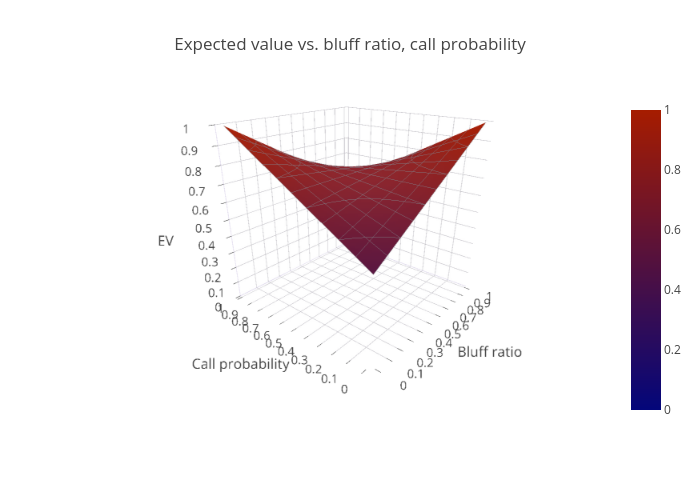
Drucev's interactive graph and data of "Expected value vs. bluff ratio, call probability" is a surface, showing trace0. The x-axis shows values from 0 to 0. The y-axis shows values from 0 to 0.