Edit chart
Loading graph
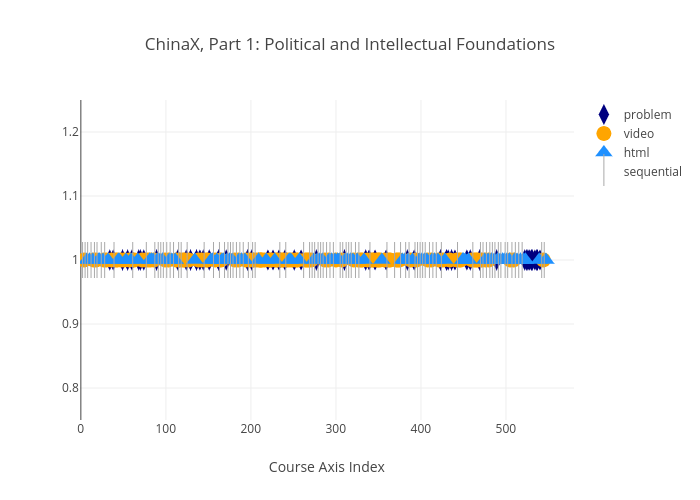
Dseaton's interactive graph and data of "ChinaX, Part 1: Political and Intellectual Foundations" is a scatter chart, showing problem, video, html, sequential; with Course Axis Index in the x-axis. The x-axis shows values from -1 to 580. The y-axis shows values from 0.75 to 1.25.