Edit chart
Loading graph
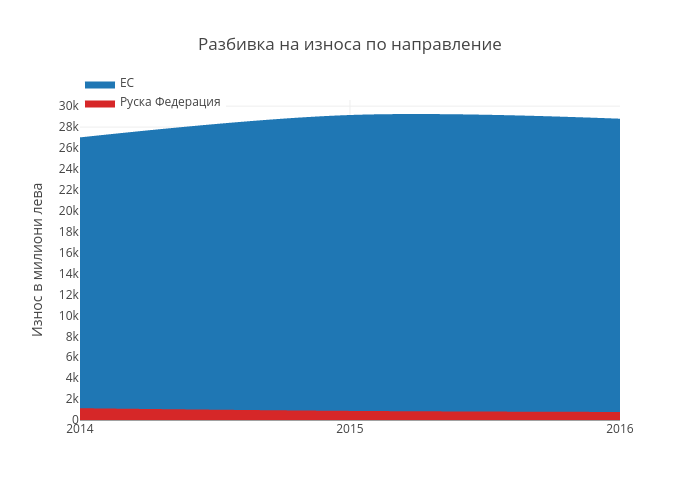
Dshalvardjiev's interactive graph and data of "Разбивка на износа по направление" is a filled line chart, showing Руска Федерация vs ЕС; with in the x-axis and Износ в милиони лева in the y-axis.. The x-axis shows values from 2014 to 2016. The y-axis shows values from 0 to 30590.736842105263.