Edit chart
Loading graph
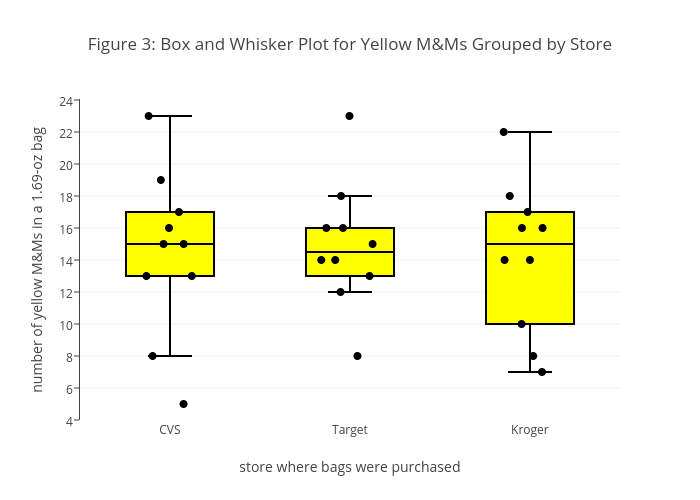
Dtharvey's interactive graph and data of "Figure 3: Box and Whisker Plot for Yellow M&Ms Grouped by Store" is a box plot, showing yellow; with store where bags were purchased in the x-axis and number of yellow M&Ms in a 1.69-oz bag in the y-axis.. The x-axis shows values from -0.5 to 2.5. The y-axis shows values from 4 to 24.