Edit chart
Loading graph
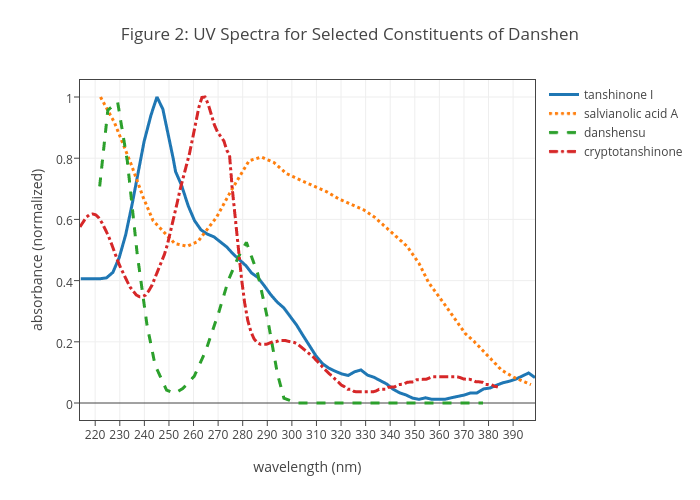
Dtharvey's interactive graph and data of "Figure 2: UV Spectra for Selected Constituents of Danshen" is a line chart, showing tanshinone I, salvianolic acid A, danshensu, cryptotanshinone; with wavelength (nm) in the x-axis and absorbance (normalized) in the y-axis.. The x-axis shows values from 213.8160217 to 398.9. The y-axis shows values from -0.05555555555555557 to 1.0555555555555556.