Edit chart
Loading graph
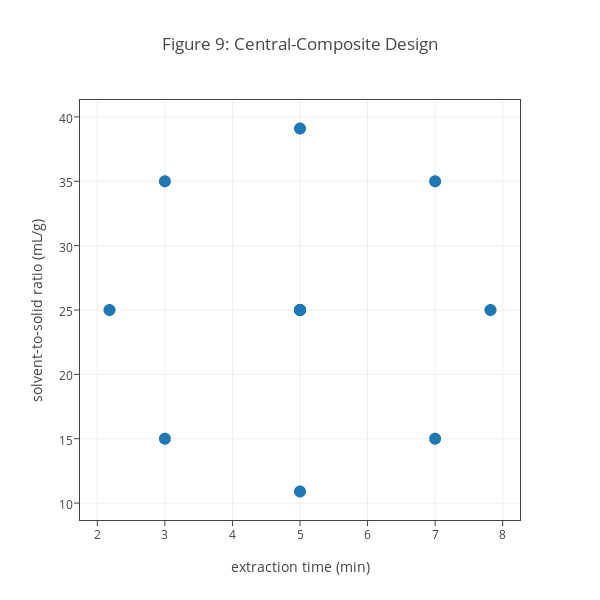
Dtharvey's interactive graph and data of "Figure 9: Central-Composite Design" is a scatter chart, showing 15, 25, 35, 10.9, 39.1; with extraction time (min) in the x-axis and solvent-to-solid ratio (mL/g) in the y-axis.. The x-axis shows values from 1.7433070866141733 to 8.256692913385827. The y-axis shows values from 8.685950413223141 to 41.31404958677686.