Edit chart
Loading graph
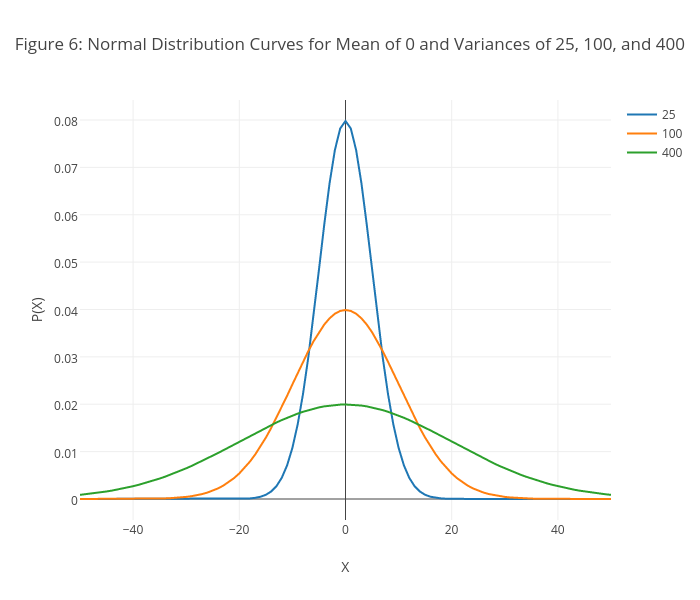
Dtharvey's interactive graph and data of "Figure 6: Normal Distribution Curves for Mean of 0 and Variances of 25, 100, and 400" is a scatter chart, showing 25, 100, 400; with X in the x-axis and P(X) in the y-axis.. The x-axis shows values from -50 to 50. The y-axis shows values from -0.00443269200446036 to 0.08422114808474686.