Edit chart
Loading graph
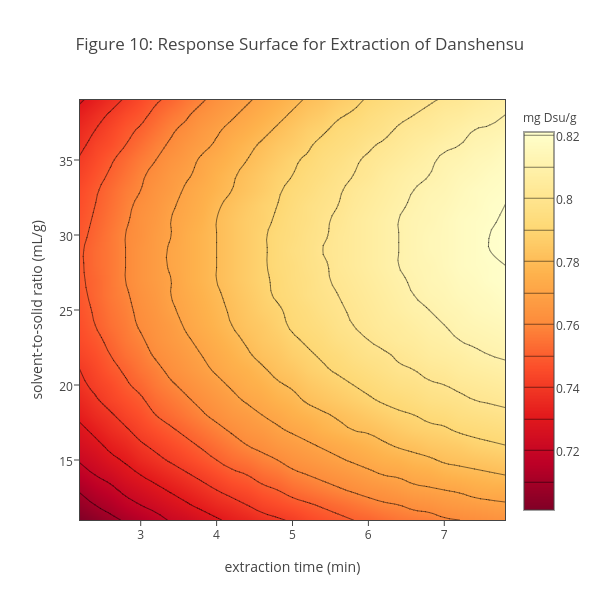
Dtharvey's interactive graph and data of "Figure 10: Response Surface for Extraction of Danshensu" is a contour, showing dtharvey:37:80SBCYO2IJ27N23CIJHX5V2GSY892XXL; with extraction time (min) in the x-axis and solvent-to-solid ratio (mL/g) in the y-axis.. The x-axis shows values from 2.2 to 7.8. The y-axis shows values from 11 to 39.