Edit chart
Loading graph
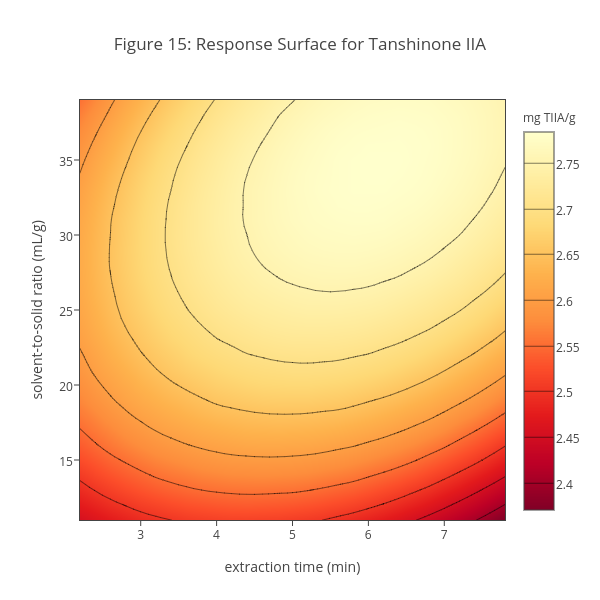
Dtharvey's interactive graph and data of "Figure 15: Response Surface for Tanshinone IIA" is a contour, showing dtharvey:47:8KUUBBF9MSNQH18OW3BTIRW4Q5MYKBIZ; with extraction time (min) in the x-axis and solvent-to-solid ratio (mL/g) in the y-axis.. The x-axis shows values from 2.2 to 7.8. The y-axis shows values from 11 to 39.