Edit chart
Loading graph
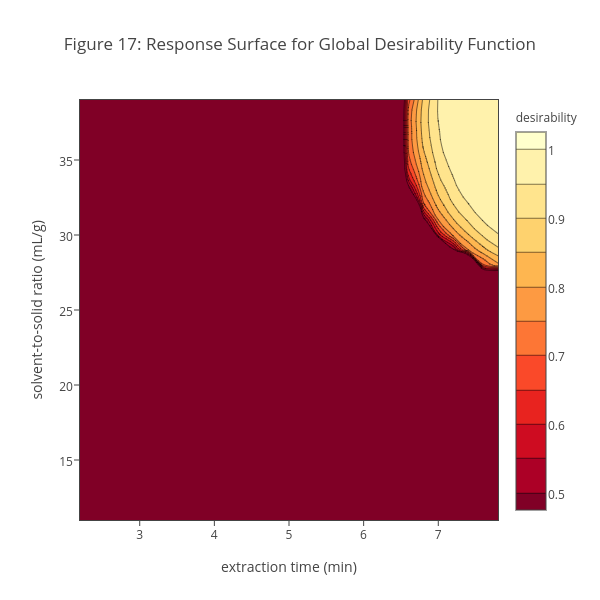
Dtharvey's interactive graph and data of "Figure 17: Response Surface for Global Desirability Function" is a contour, showing dtharvey:54:NIVGI5S7KUDU4LKTOZ3KRCTU9Y4SFT6Z; with extraction time (min) in the x-axis and solvent-to-solid ratio (mL/g) in the y-axis.. The x-axis shows values from 2.2 to 7.8. The y-axis shows values from 11 to 39.