Edit chart
Loading graph
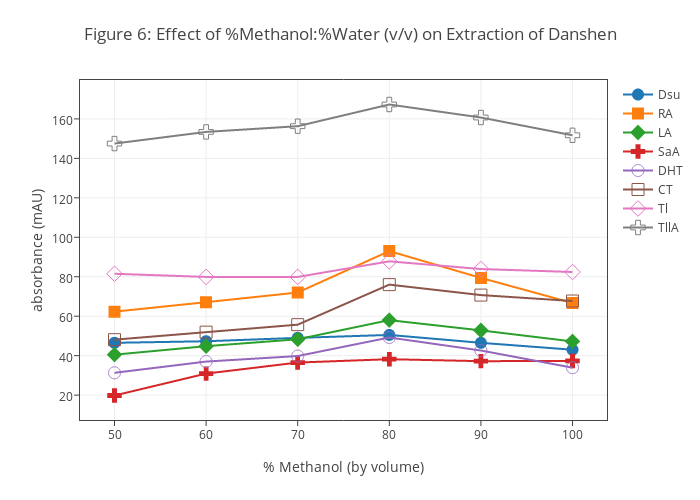
Dtharvey's interactive graph and data of "Figure 6: Effect of %Methanol:%Water (v/v) on Extraction of Danshen" is a scatter chart, showing Dsu, RA, LA, SaA, DHT, CT, Tl, TllA; with % Methanol (by volume) in the x-axis and absorbance (mAU) in the y-axis.. The x-axis shows values from 47.22222222222222 to 102.77777777777777. The y-axis shows values from 11.605555555555556 to 175.49444444444447.