Edit chart
Loading graph
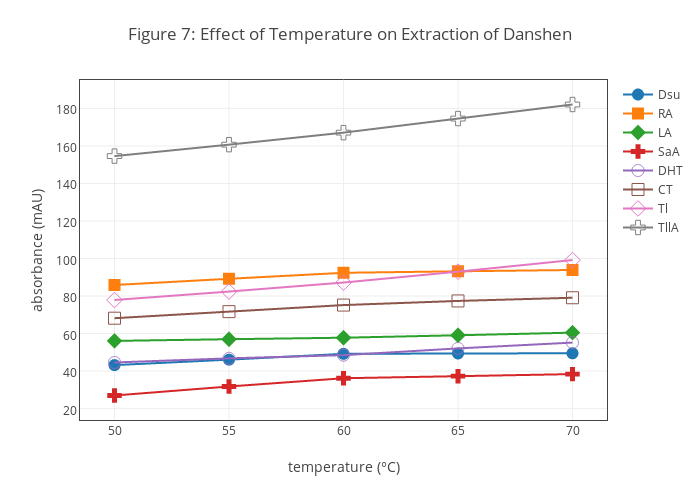
Dtharvey's interactive graph and data of "Figure 7: Effect of Temperature on Extraction of Danshen" is a scatter chart, showing Dsu, RA, LA, SaA, DHT, CT, Tl, TllA; with temperature (°C) in the x-axis and absorbance (mAU) in the y-axis.. The x-axis shows values from 48.888888888888886 to 71.11111111111111. The y-axis shows values from 18.383333333333333 to 190.71666666666667.