Edit chart
Loading graph
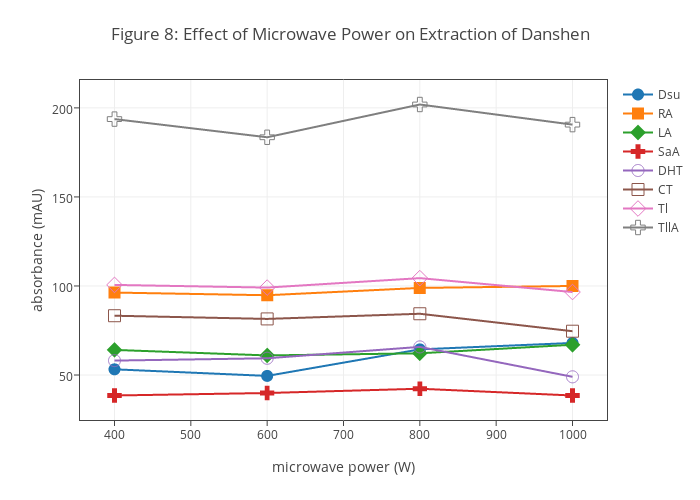
Dtharvey's interactive graph and data of "Figure 8: Effect of Microwave Power on Extraction of Danshen" is a scatter chart, showing Dsu, RA, LA, SaA, DHT, CT, Tl, TllA; with microwave power (W) in the x-axis and absorbance (mAU) in the y-axis.. The x-axis shows values from 366.6666666666667 to 1033.3333333333333. The y-axis shows values from 29.42222222222222 to 210.9777777777778.