Edit chart
Loading graph
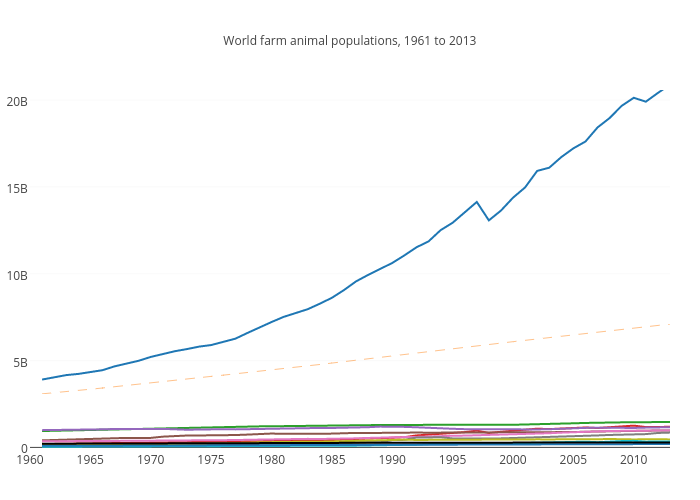
Dubrovskys's interactive graph and data of "World farm animal populations, 1961 to 2013" is a scatter chart, showing Chickens, We the people, Cattle, Ducks, Sheep, Pigs, Goats, Rabbits and hare, Turkeys, Geese and guinea fowls, Buffaloes, All others (as captured by FAO). The x-axis shows values from 1960 to 2013. The y-axis shows values from -149490660.00959527 to 20579750773.595345.