Edit chart
Loading graph
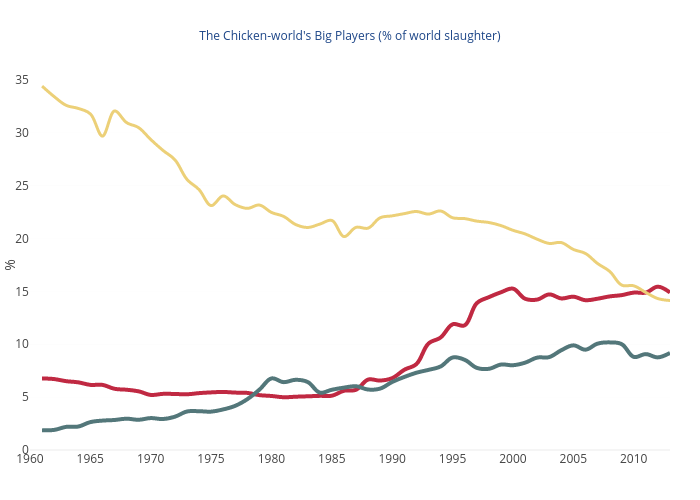
Dubrovskys's interactive graph and data of "The Chicken-world's Big Players (% of world slaughter)" is a scatter chart, showing China, United States of America , Brazil ; with % in the y-axis. The x-axis shows values from 1960 to 2013. The y-axis shows values from 0 to 35.