Edit chart
Loading graph
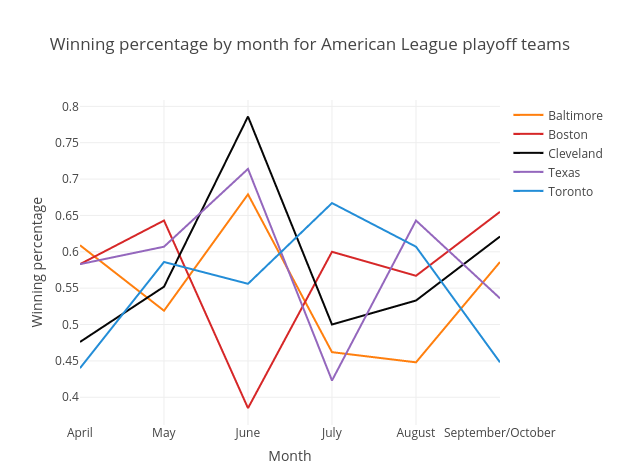
Egilbert's interactive graph and data of "Winning percentage by month for American League playoff teams " is a line chart, showing Baltimore, Boston, Cleveland, Texas, Toronto; with Month in the x-axis and Winning percentage in the y-axis.. The x-axis shows values from 1 to 6. The y-axis shows values from 0.3627222222222222 to 0.8082777777777778.