Edit chart
Loading graph
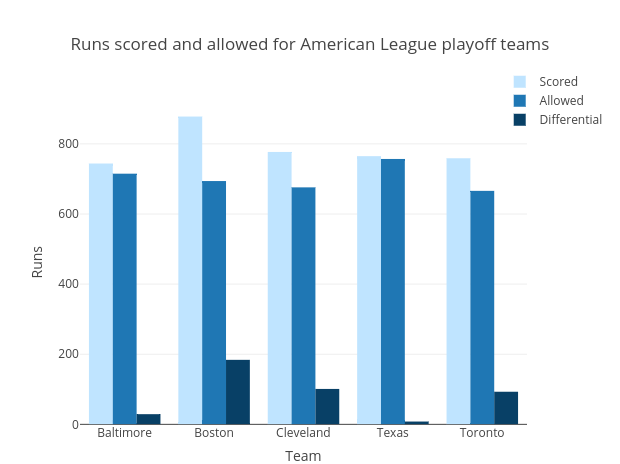
Egilbert's interactive graph and data of "Runs scored and allowed for American League playoff teams" is a bar chart, showing Scored, Allowed, Differential; with Team in the x-axis and Runs in the y-axis.. The x-axis shows values from -0.5 to 4.5. The y-axis shows values from 0 to 924.2105263157895.