Edit chart
Loading graph
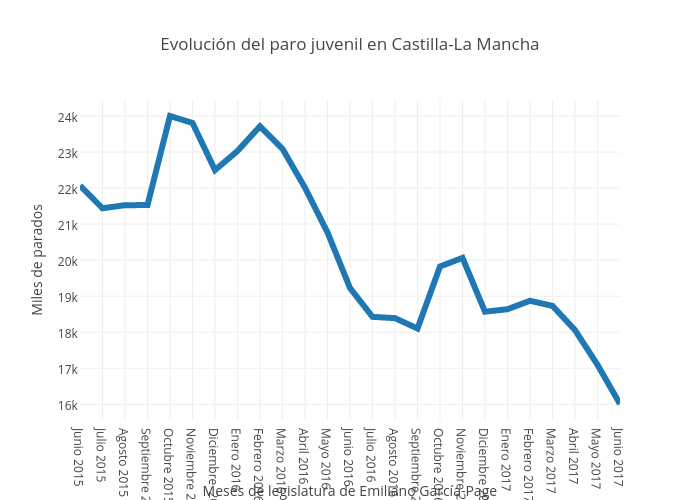
Eldiarioclm's interactive graph and data of "Evolución del paro juvenil en Castilla-La Mancha" is a line chart, showing A; with Meses de legislatura de Emiliano García-Page in the x-axis and Miles de parados in the y-axis.. The x-axis shows values from 0 to 24. The y-axis shows values from 15565.055555555555 to 24443.944444444445.