Edit chart
Loading graph
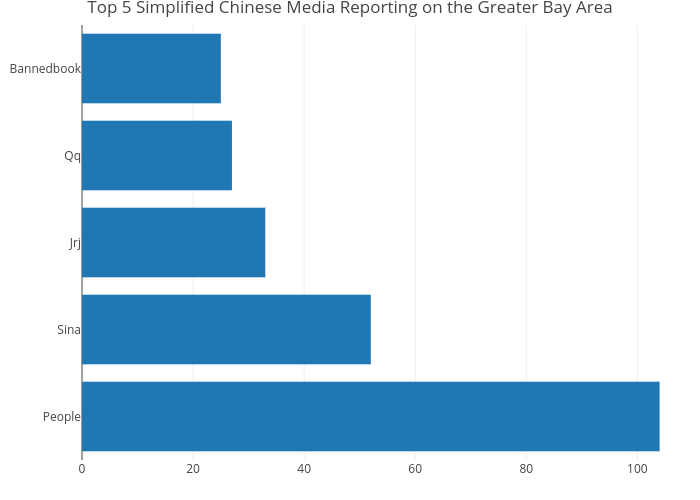
Elgarteo95's interactive graph and data of "Top 5 Simplified Chinese Media Reporting on the Greater Bay Area" is a bar chart, showing SC; with [] in the x-axis and [] in the y-axis.. The x-axis shows values from 0 to 109.47368421052632. The y-axis shows values from -0.5 to 4.5.