Edit chart
Loading graph
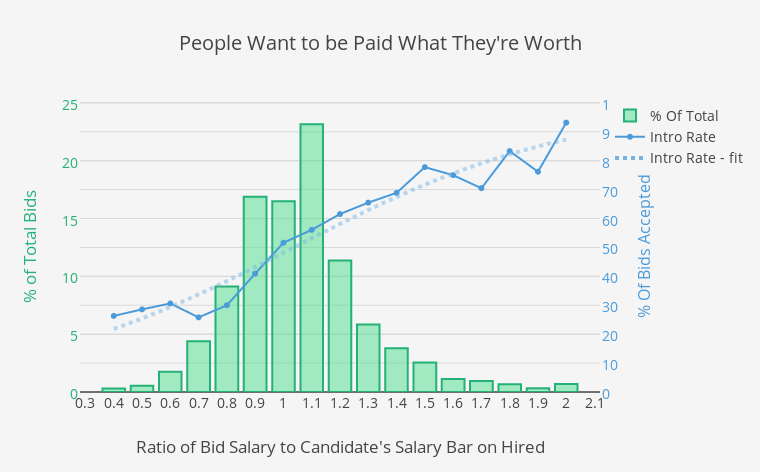
Elliotk's interactive graph and data of "People Want to be Paid What They're Worth" is a grouped bar chart, showing % Of Total, Intro Rate, Intro Rate - fit; with Ratio of Bid Salary to Candidate's Salary Bar on Hired in the x-axis and % of Total Bids in the y-axis.. The x-axis shows values from 0.2837004405286344 to 2.116299559471366. The y-axis shows values from 0 to 25.25.