Edit chart
Loading graph
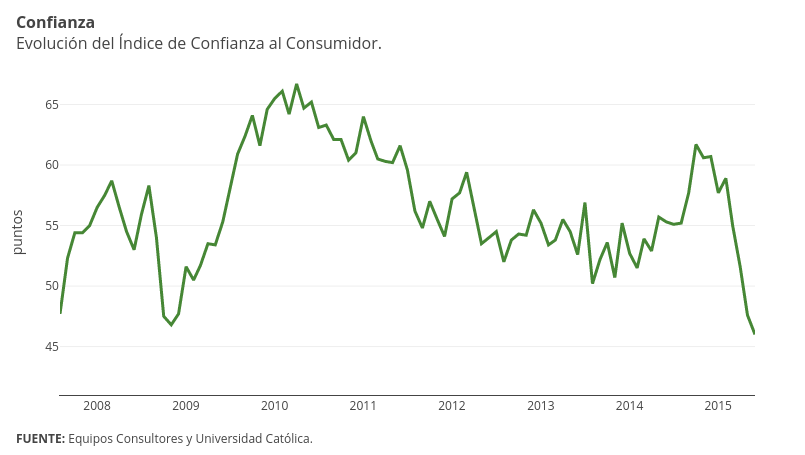
Emiliasalaverria's interactive graph and data of "puntos vs time" is a scatter chart, showing Col2; with time in the x-axis and puntos in the y-axis.. The x-axis shows values from 1185937200000 to 1433127600000. The y-axis shows values from 41 to 67.85000000000001. This visualization has the following annotations: ConfianzaEvolución del Índice de Confianza al Consumidor.; FUENTE: Equipos Consultores y Universidad Católica.