Edit chart
Loading graph
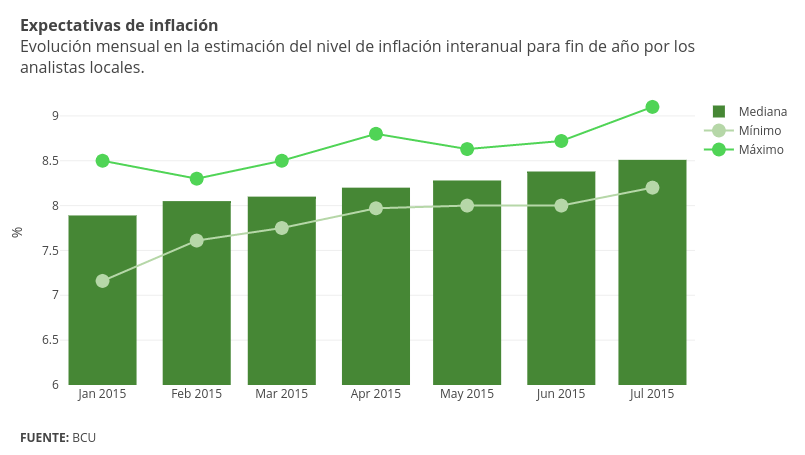
Emiliasalaverria's interactive graph and data of "% vs time" is a bar chart, showing Mediana, Mínimo, Máximo; with time in the x-axis and % in the y-axis.. The x-axis shows values from 1418868000000 to 1436929200000. The y-axis shows values from 6 to 9.4. This visualization has the following annotations: Expectativas de inflaciónEvolución mensual en la estimación del nivel de inflación interanual para fin de año por losanalistas locales.; FUENTE: BCU