Edit chart
Loading graph
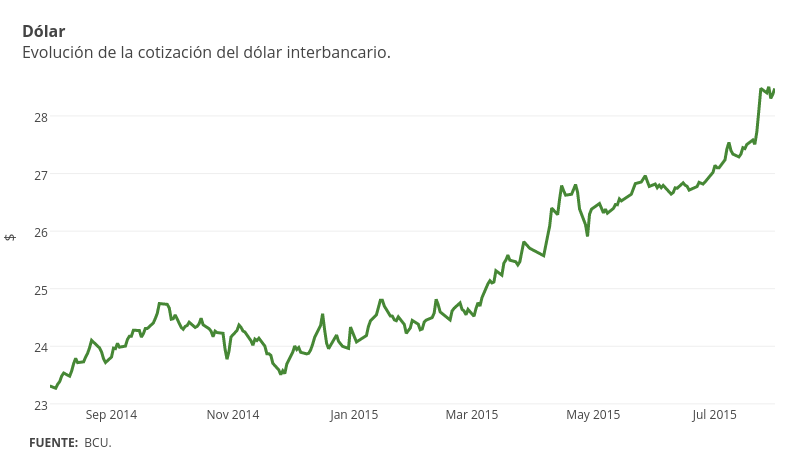
Emiliasalaverria's interactive graph and data of "$ vs time" is a scatter chart, showing Col2; with time in the x-axis and $ in the y-axis.. The x-axis shows values from 1406862000000 to 1438311600000. The y-axis shows values from 22.98011111111111 to 28.79788888888889. This visualization has the following annotations: DólarEvolución de la cotización del dólar interbancario.; FUENTE: BCU.